2D HT Lab4: Modeling of Quenching of a Gear Tooth
4.1. Opening Project file
4.2. Adding operation
4.3. Setting Simulation Controls
4.4. Setting Object Properties
4.5. Generating a Database
4.6. Running a Simulation
4.7. Post-Processing the Results
Opening Project file
OThe DEFORM GUI MAIN window should already be open. With the Gear_Blank.moproj file highlighted in the file list, click on ![]() as shown in Fig. 2DHTML2.1. Integrated Manufacturing Proc. will open.
as shown in Fig. 2DHTML2.1. Integrated Manufacturing Proc. will open.
Adding operation
Add 2D Forming operation from Operations list in Explorer. Operation can be added by clicking on ![]() button next to 2DForming operation or user can also add the operation by dragging and dropping the operation into Operation Editor region.
button next to 2DForming operation or user can also add the operation by dragging and dropping the operation into Operation Editor region.
Select 4th operation from Operation editor, Setup type popup will appear, click on ![]() button. Click on
button. Click on ![]() .
.
Setting Simulation Controls
Select Main![]() **tab, Change the Operation Name to **Quench. Turn off Diffusion module and turn on the Deformation module as shown in Fig. 2DHTML4.1.
**tab, Change the Operation Name to **Quench. Turn off Diffusion module and turn on the Deformation module as shown in Fig. 2DHTML4.1.
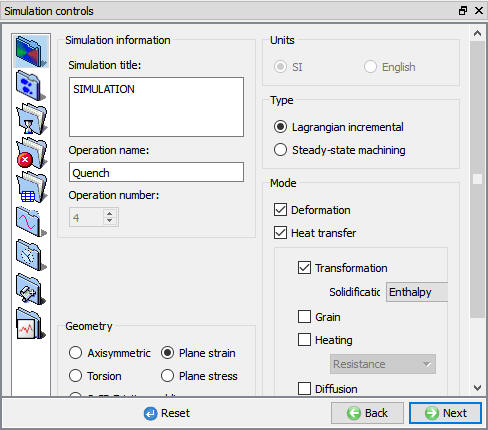
Simulation controls Main tab in Expert mode
Select StepIncrement![]() **tab, Set solution Step Definition to Constant **Temperature. Specify Initial/Minimum time step as 0.01 seconds per step and Max Temperature Change per Step should be set to 5 C. Max Temperature time step to 20 seconds per step. (See Fig. 2DHTML4.2.)
**tab, Set solution Step Definition to Constant **Temperature. Specify Initial/Minimum time step as 0.01 seconds per step and Max Temperature Change per Step should be set to 5 C. Max Temperature time step to 20 seconds per step. (See Fig. 2DHTML4.2.)
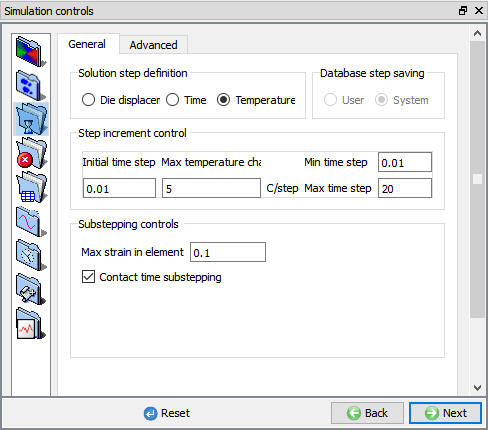
Step Increment tab in Expert mode
Select StoppingControls![]() **tab, and set **ProcessDuration to 13500 seconds as shown in Fig. 2DHTML4.3.
**tab, and set **ProcessDuration to 13500 seconds as shown in Fig. 2DHTML4.3.
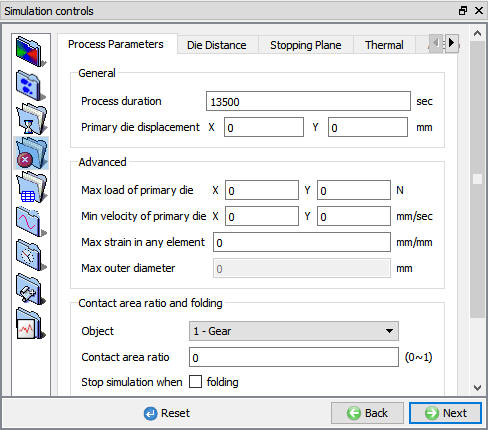
Stopping Controls tab in Expert mode
Under Process Conditions,Set the environmenttemperature to 20 C and change the convection coefficient to 4.093 as shown in Fig. 2DHTML4.4. This convection coefficient is similar to the convection coefficient of certain quench oil. Click on ![]() until Workpiece Property page.
until Workpiece Property page.
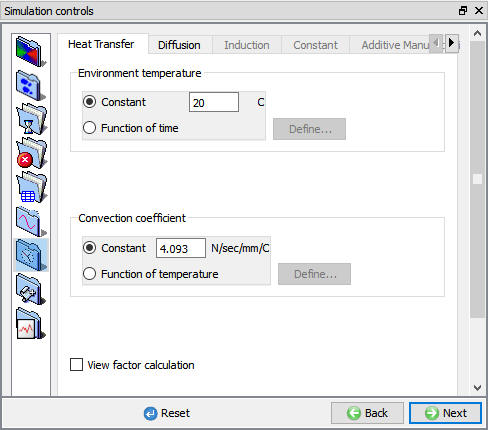
Process Conditions window
Setting Object Properties
At this point the user will set the hardness calculation type to volume fraction method. Click on the workpiece Property tab. Set the Hardness estimation type to UsingVolumeFractions.as shown in Fig. 2DHTML4.5.
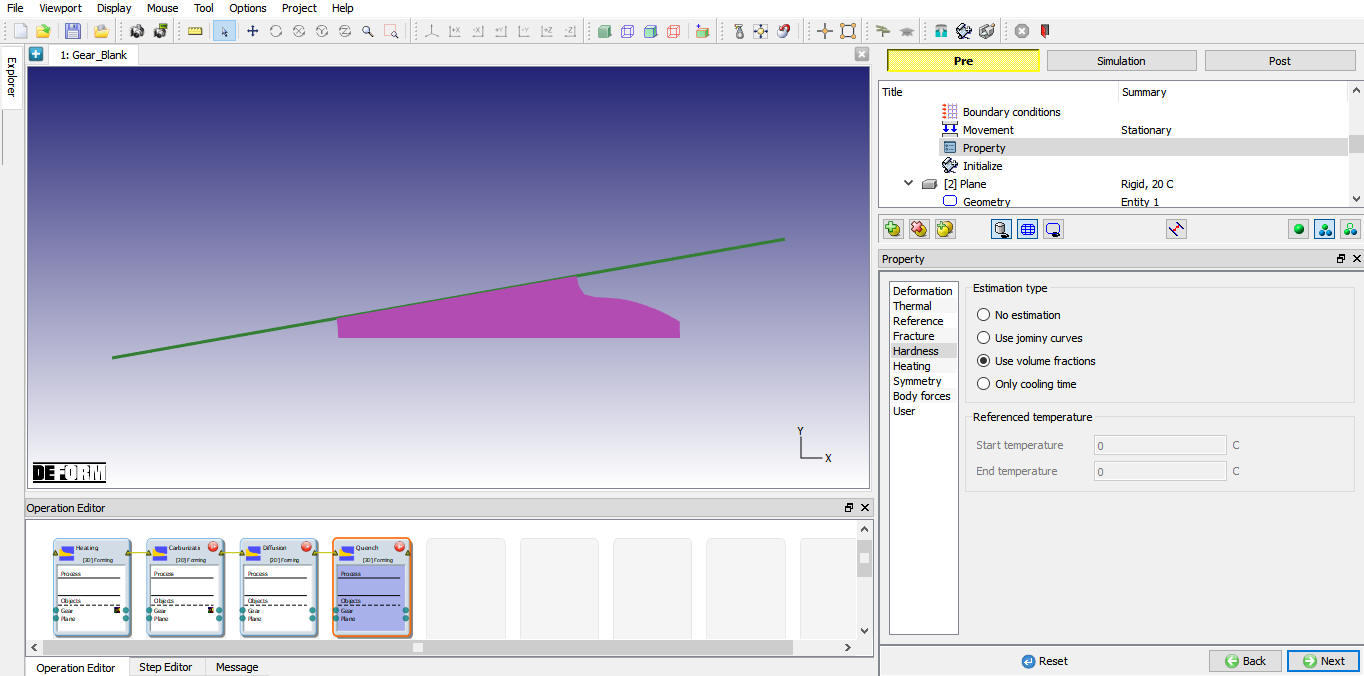
Object property window
Generating a Database
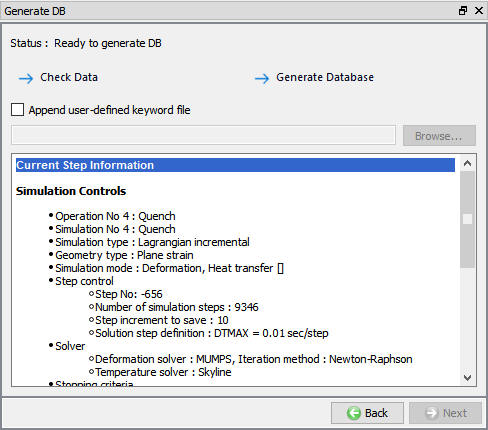
In Generate DB page. Click the ![]() button to have the program check to see if anything was missed in the problem setup. During the checking process, messages in the red color signify data that needs to be fixed before a simulation can be run (such as when you forget to define any material data).If there are no errors shown, then the database can be generated.
button to have the program check to see if anything was missed in the problem setup. During the checking process, messages in the red color signify data that needs to be fixed before a simulation can be run (such as when you forget to define any material data).If there are no errors shown, then the database can be generated.
Click on ![]() button to generate the database (see Fig. 2DHTML4.6.). When the program is done writing the database, switch to
button to generate the database (see Fig. 2DHTML4.6.). When the program is done writing the database, switch to ![]() tab to run simulation.
tab to run simulation.
Generate Database
Running a Simulation
Click on the ![]() action label to open the Run Options dialog. Use the default Continue Run option to select “Continue from the last step ” option and then select the Simulation mode as Interactive and click on
action label to open the Run Options dialog. Use the default Continue Run option to select “Continue from the last step ” option and then select the Simulation mode as Interactive and click on ![]() button to run the simulation. As we click on
button to run the simulation. As we click on ![]() **button simulation starts.
**button simulation starts.
When the simulation is finished without any issues, the following message will be added to the end of the Message file as shown in Fig. 2DHTML4.7.
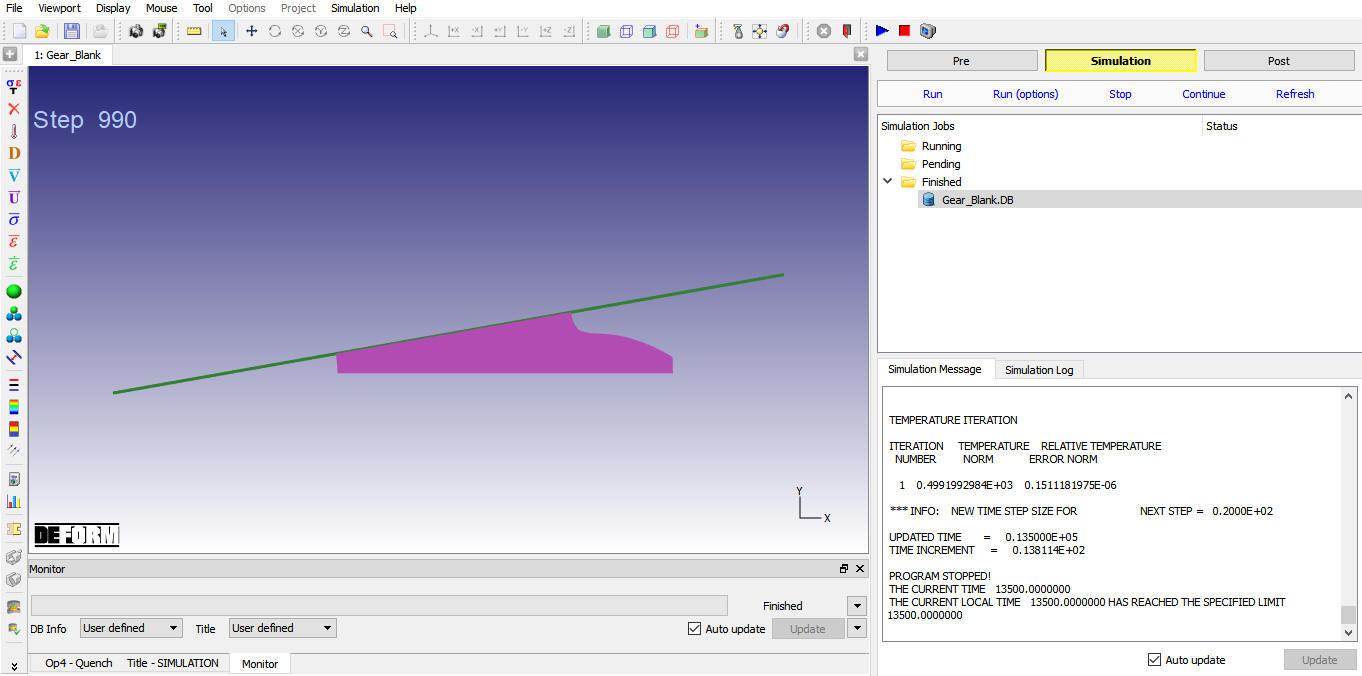
Simulation message tab
Post-Processing the Results
After simulation has been completed, switch to ![]() tab to view results, MO post processor will open.
tab to view results, MO post processor will open.
The user may be interested in the state variables Phase Volume Fractions. Go to the last step of the database. Click the State Variables ![]() button to open the state variable dialog. Select the variable Volume Fractions(Pearlite) under Microstructure and plot the variables as shaded contours. This gives the prediction of the microstructure of the gear tooth as a function of position. At the end of quench, the material near the surface is mostly Martensite, while the center is mostly Pearlite. In addition, the user may be concerned about the quench distortion and residual stress that are caused by the heterogeneous transformation volume changes and thermal contraction. To examine the distortion, select the variable Total Displacement under Deformation and plot the variables as Deflection plot. You may like to drag the Deflection Scale bar to amplify the deflection. For residual stress, select the Effective Stress and plot the variable as shade contour. ( See Fig. 2DHTML4.8. to Fig. 2DHTML4.10.).
button to open the state variable dialog. Select the variable Volume Fractions(Pearlite) under Microstructure and plot the variables as shaded contours. This gives the prediction of the microstructure of the gear tooth as a function of position. At the end of quench, the material near the surface is mostly Martensite, while the center is mostly Pearlite. In addition, the user may be concerned about the quench distortion and residual stress that are caused by the heterogeneous transformation volume changes and thermal contraction. To examine the distortion, select the variable Total Displacement under Deformation and plot the variables as Deflection plot. You may like to drag the Deflection Scale bar to amplify the deflection. For residual stress, select the Effective Stress and plot the variable as shade contour. ( See Fig. 2DHTML4.8. to Fig. 2DHTML4.10.).
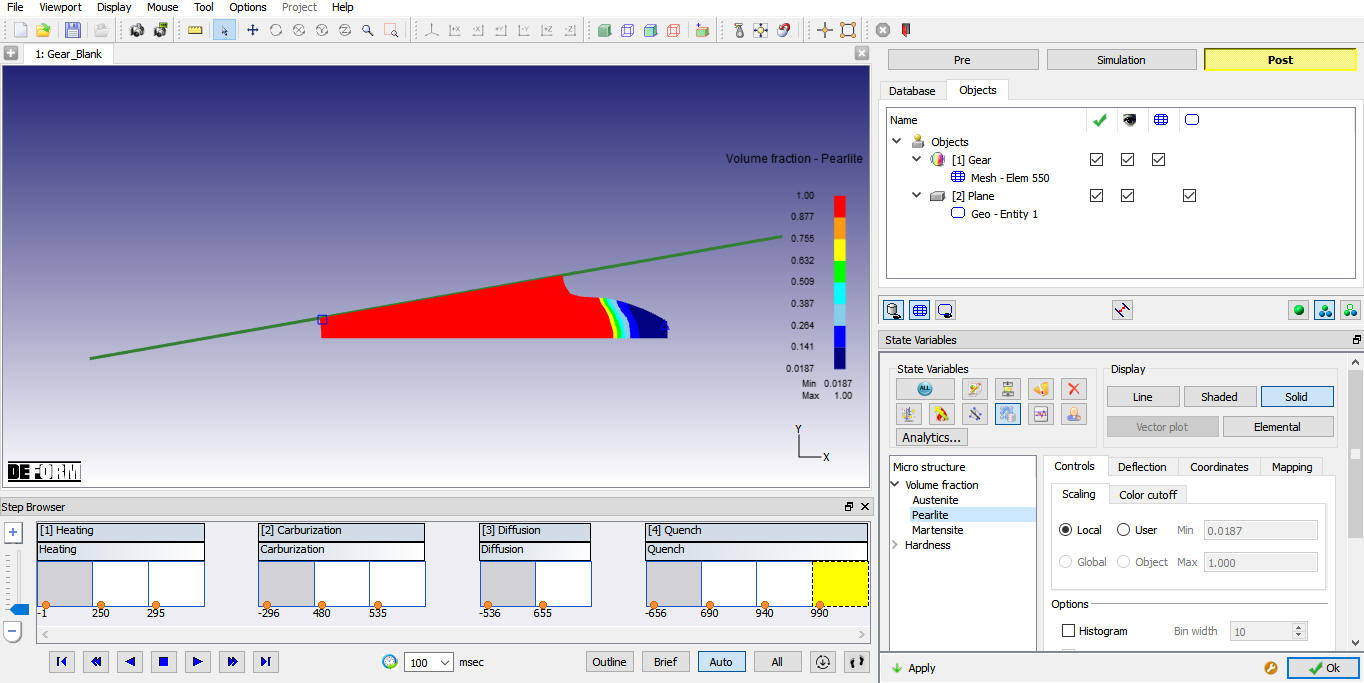
Volume-Fraction Pearlite plot
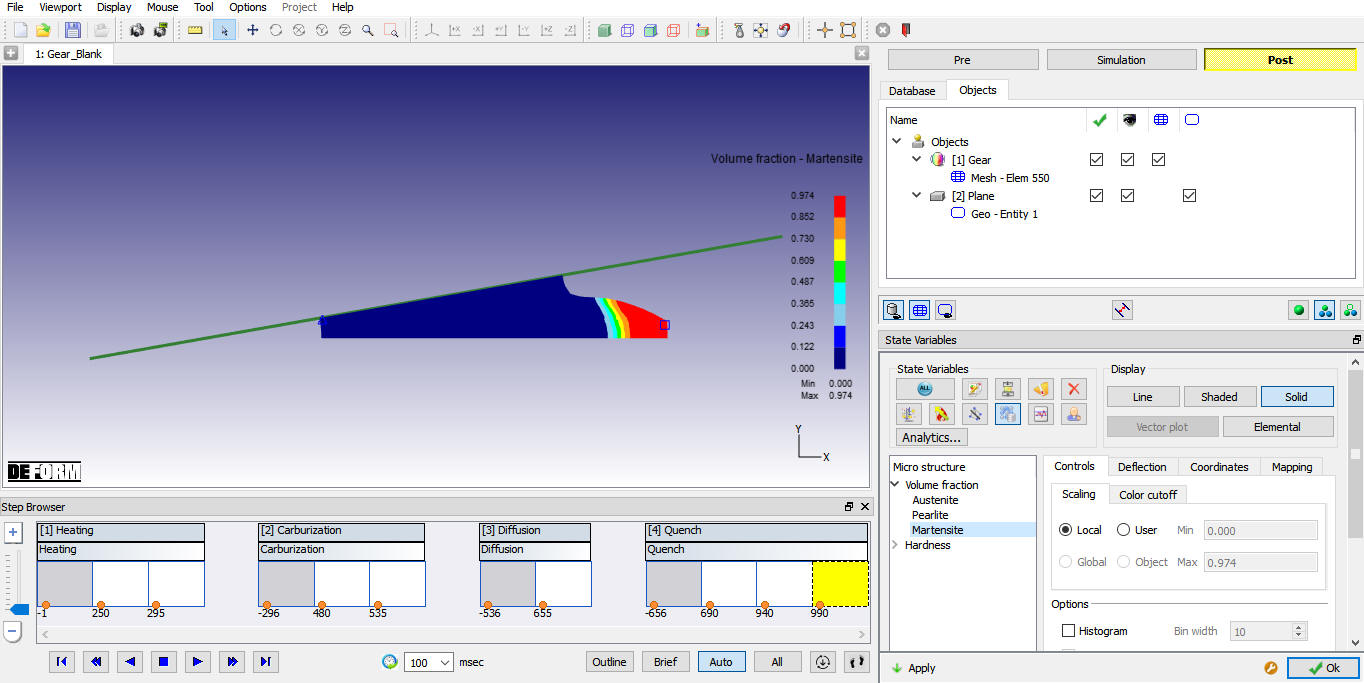
Volume-Fraction Martensite plot
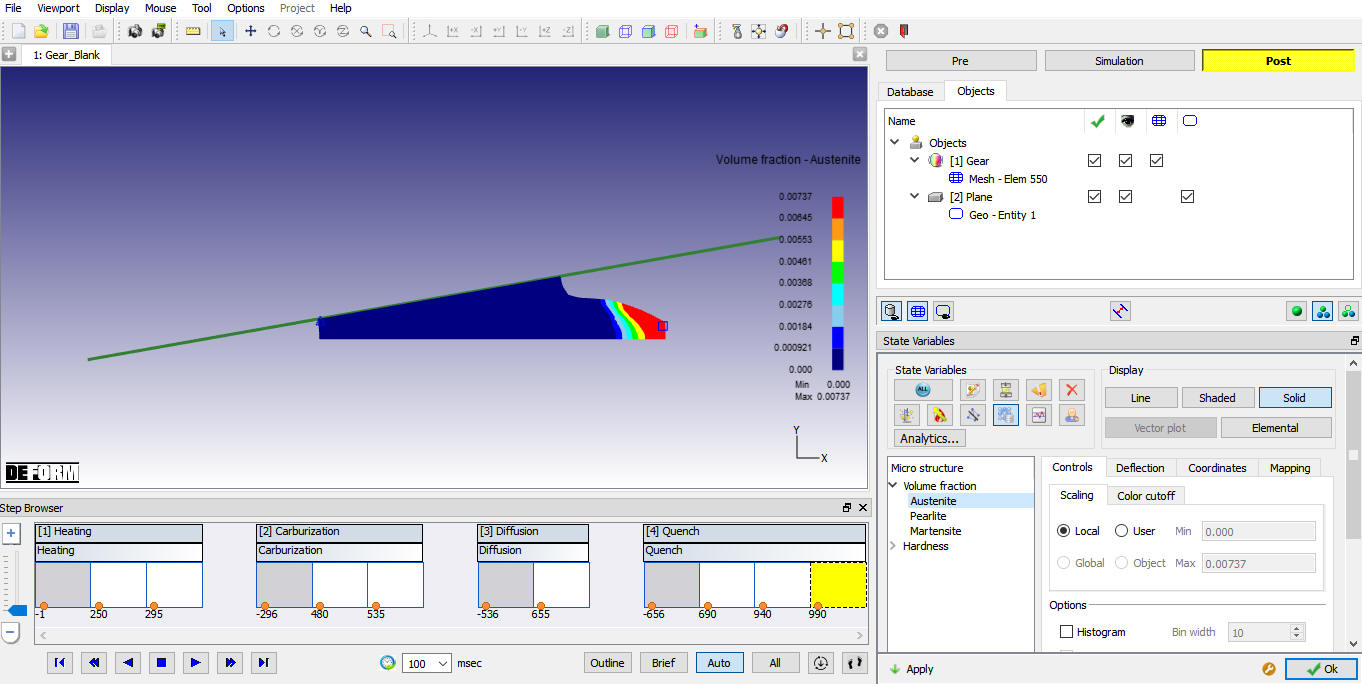
Volume-Fraction Austenite
Another important state variable in this simulation is the Hardness variable. Select the variable Hardness under Microstructure and plot the variables as shaded contours. You can see that the hardness (in Rockwell C) is high where Martensite is high and low where Pearlite is high.( Fig. 2DHTML4.11.)
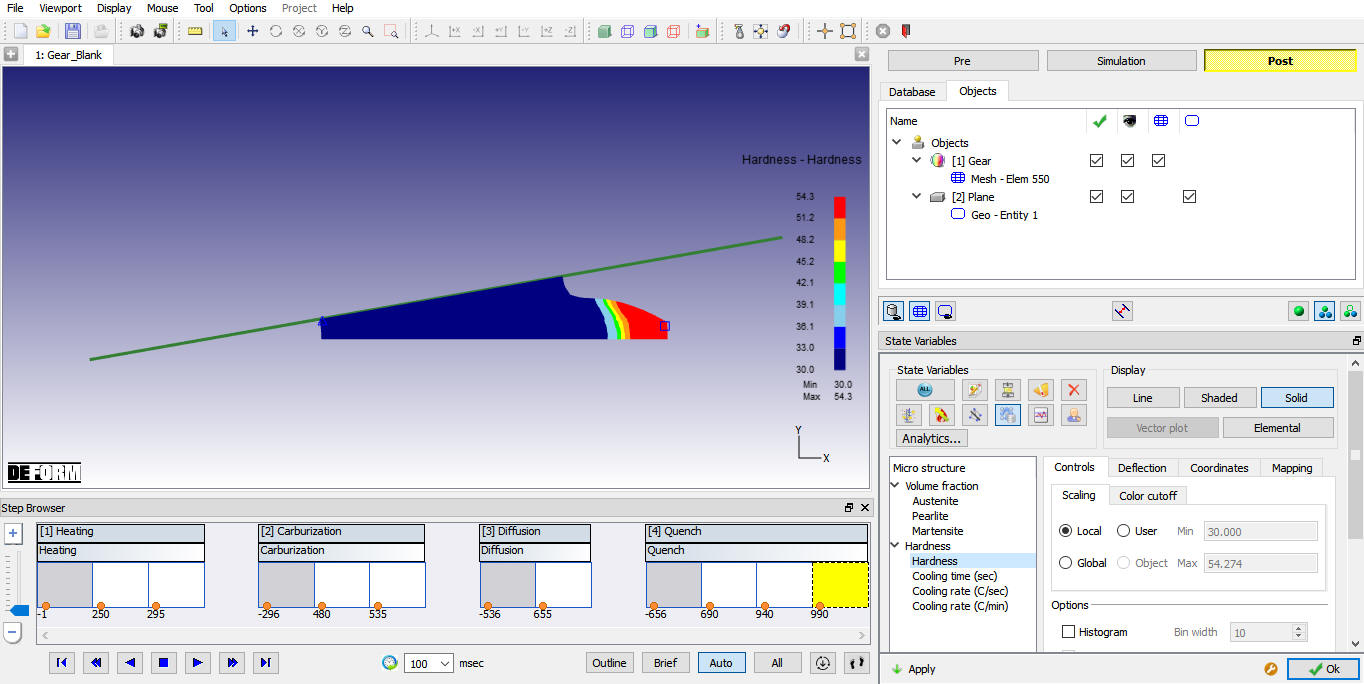
Hardness plot
After completion of Post processing, Save the Project and close the MO wizard by clicking Quit ![]() button or selecting Quit option under File menu. If User wants to continue the setup, can switch to pre mode directly and continue the setup by adding operation.
button or selecting Quit option under File menu. If User wants to continue the setup, can switch to pre mode directly and continue the setup by adding operation.
Related Topics: